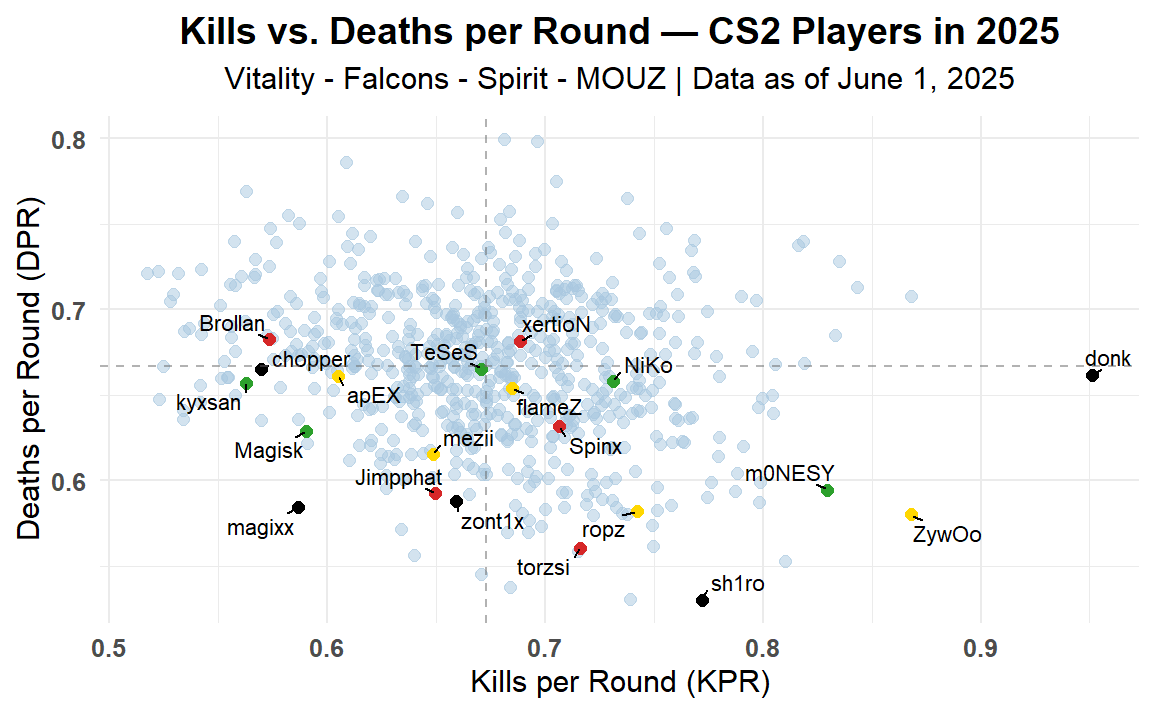
Scatterplot of Kills per Round (KPR) vs. Deaths per Round (DPR). Background points show all CS2 pro players with ≥50 maps in 2025. Data from Jan 1 to Jun 1, 2025. Created with R & ggplot2.

Scatterplot of Kills per Round (KPR) vs. Deaths per Round (DPR). Background points show all CS2 pro players with ≥50 maps in 2025. Data from Jan 1 to Jun 1, 2025. Created with R & ggplot2.
2 Comments
I love the reoccurring pattern of graphs like these. The mechanically best players are in their own group, and then there’s donk. In a galaxy of his own.
And people saying donk is not the best player in the world just cause his team isn’t as stacked as zywoos.