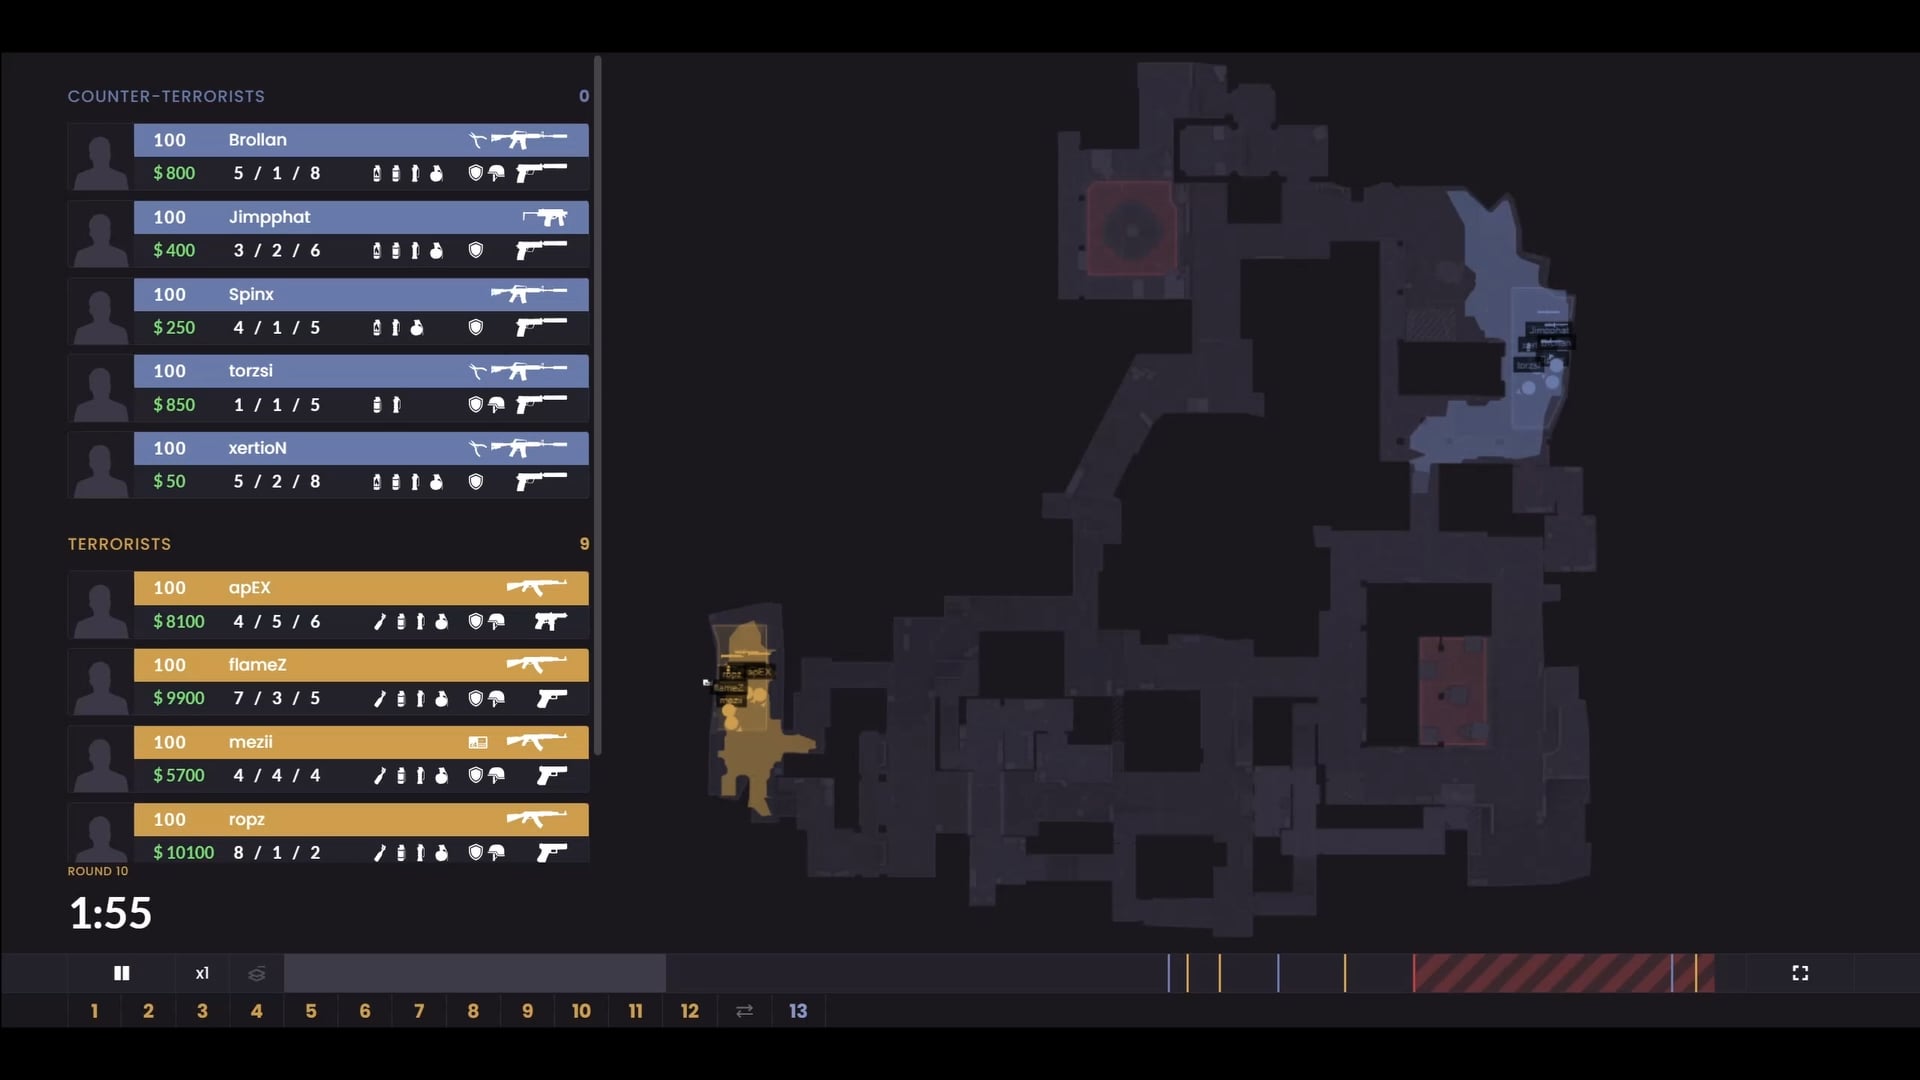
This is a proof of concept that shows what map control looks like between the CTs and Ts during a round. It’s calculated based on map geometry and demo data for player positions, grenades etc. Round taken from the BLAST Lisbon 2025 final between Vitality & MOUZ. Let us know what you think!
notsarge
I like this
EpicHeroGuy
It would be pretty cool if you could predict which team would win a round (before any kills have taken place) just based on how much map control is given/taken. I’d love to know how important map control is, based on data.
KaSacha
Would be really cool with less played maps to understand what zone to take / retake throughout a round
norbertosnt
This is really cool, well done!
_sanct
Extremely interesting visualization. Thanks!
Sirius__cH
It would be nice to have a “map control taker” rating per player.
ONE_CON
this is awesome
Surymy
Sick
Sam_FS
This would be great for broadcasts if it could be done live, I think it really helps in telling the “story” of the round for newer viewers. “Why is this guy on the other side of the map to his team?” “Why are they using so much utility in this spot?” – “Oh to maintain/get map control”
pants_pants420
leetify stays winning. this is actually super sick
RSzpala
As someone who loves CS and works a lot with GIS, this is itchin’ my ‘tism.

12 Comments
This is a proof of concept that shows what map control looks like between the CTs and Ts during a round. It’s calculated based on map geometry and demo data for player positions, grenades etc. Round taken from the BLAST Lisbon 2025 final between Vitality & MOUZ. Let us know what you think!
I like this
It would be pretty cool if you could predict which team would win a round (before any kills have taken place) just based on how much map control is given/taken. I’d love to know how important map control is, based on data.
Would be really cool with less played maps to understand what zone to take / retake throughout a round
This is really cool, well done!
Extremely interesting visualization. Thanks!
It would be nice to have a “map control taker” rating per player.
this is awesome
Sick
This would be great for broadcasts if it could be done live, I think it really helps in telling the “story” of the round for newer viewers. “Why is this guy on the other side of the map to his team?” “Why are they using so much utility in this spot?” – “Oh to maintain/get map control”
leetify stays winning. this is actually super sick
As someone who loves CS and works a lot with GIS, this is itchin’ my ‘tism.