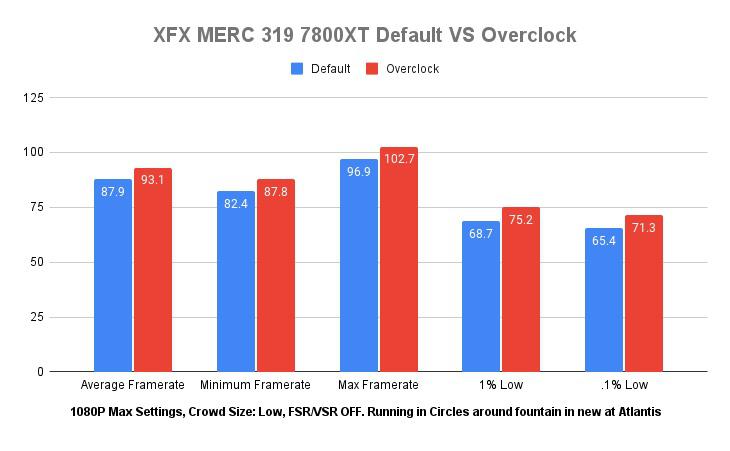
Chart I made of stock vs overclocked performance on my 7800xt.
Paired with a 7800xt with pbo and curve optimizer at 15. cl30 6000 G.Skill flare x5 with custom timings on a MSI mag b650 tomahawk pro.
Used overclocking methodology from TechPowerUp, these were the best I could get while staying crash free in Starfield.
Voltage 950mV, 3200 min Frequency, 5000 max, power limit +15%, Memory: 2606Mhz, Fast Timing Enabled, Default Fan Timing (This GPU runs insanely cool in my setup).
All settings were Ultra except crowd size set to low to minimize CPU limiting since I only have a 1080p monitor at the moment. FSR and VSR off.
% Gains: Average Framerate: 5.91% | Min Framerate: 6.55% | Max Framerate: 5.98% | 1% Low: 9.46% | .1% Low: 9.02%
Will do more testing when I get my 1440p monitor but I’m not 100% sure when that will be.

1 Comment
Chart I made of stock vs overclocked performance on my 7800xt.
Paired with a 7800xt with pbo and curve optimizer at 15. cl30 6000 G.Skill flare x5 with custom timings on a MSI mag b650 tomahawk pro.
Used overclocking methodology from TechPowerUp, these were the best I could get while staying crash free in Starfield.
Voltage 950mV, 3200 min Frequency, 5000 max, power limit +15%, Memory: 2606Mhz, Fast Timing Enabled, Default Fan Timing (This GPU runs insanely cool in my setup).
All settings were Ultra except crowd size set to low to minimize CPU limiting since I only have a 1080p monitor at the moment. FSR and VSR off.
% Gains: Average Framerate: 5.91% | Min Framerate: 6.55% | Max Framerate: 5.98% | 1% Low: 9.46% | .1% Low: 9.02%
Will do more testing when I get my 1440p monitor but I’m not 100% sure when that will be.