
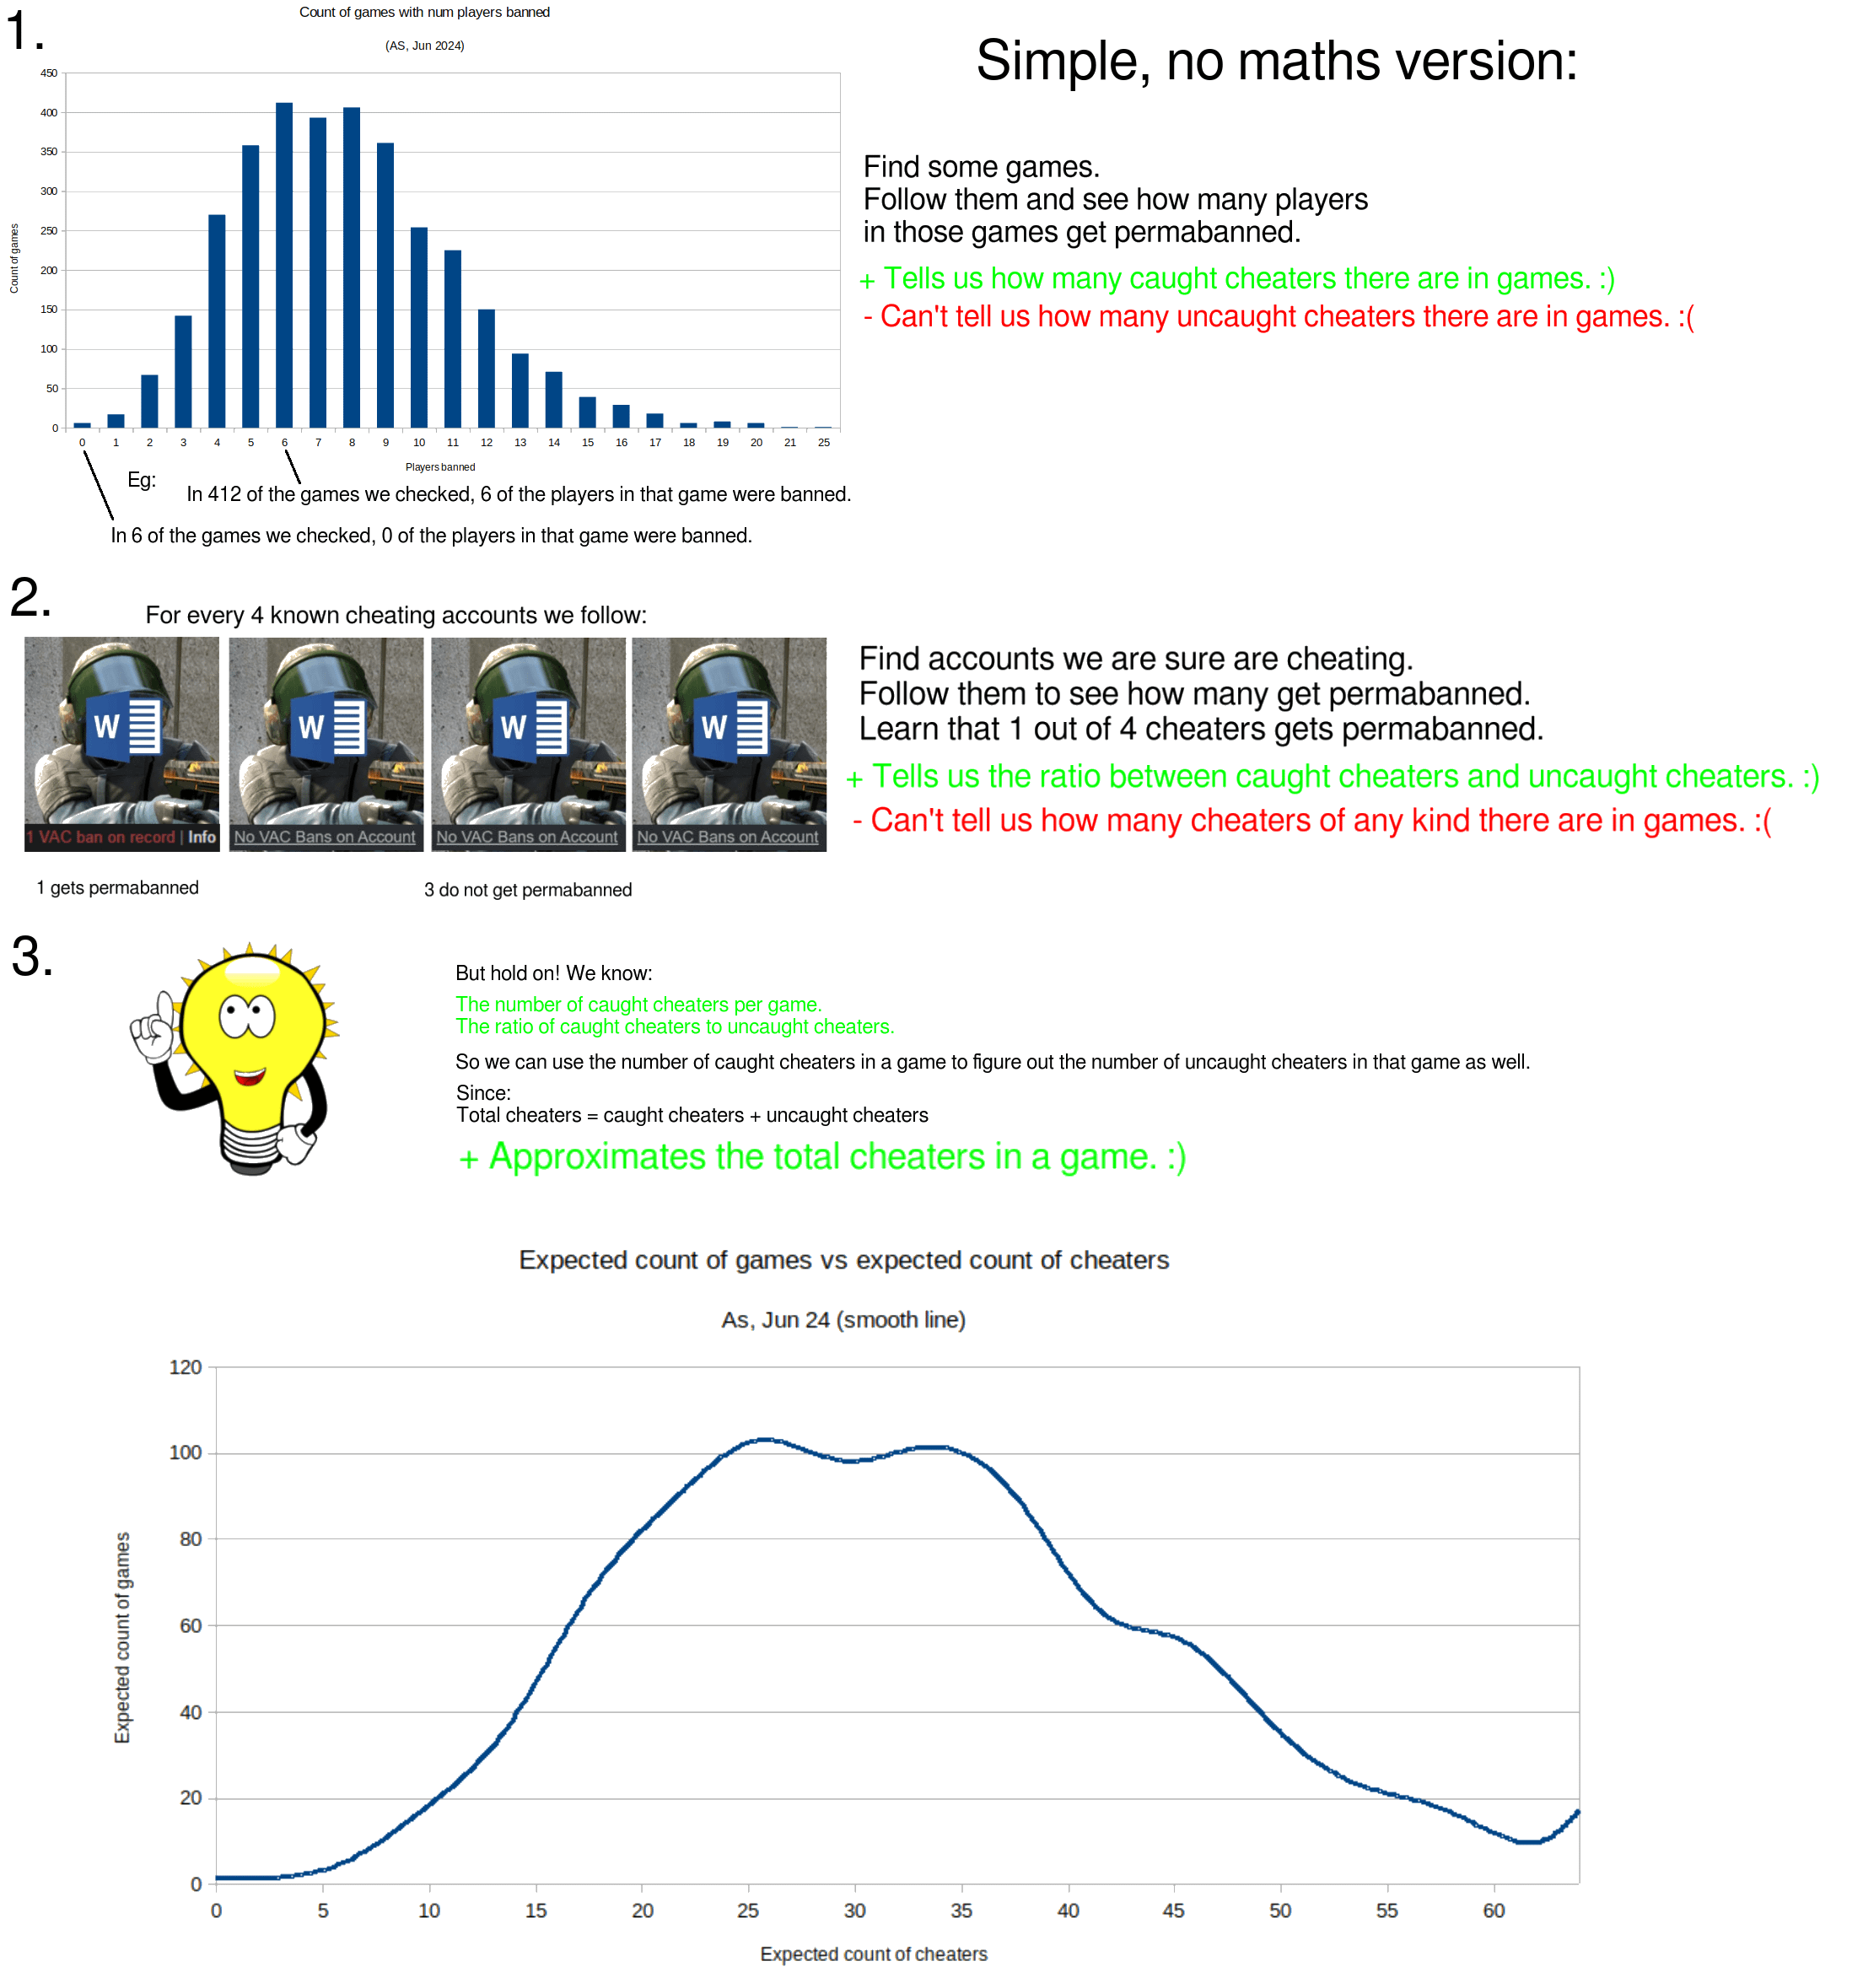
I made this picture to try to help explain the last thread where I showed the distributions of cheaters in games for different regions because it seems like the charts and text weren't anywhere near as self-explanatory as I thought and a lot of people didn't follow.
Doing a proper explanation (ie mathematically showing why doing this is valid and produces sensible and useful results) would probably require a video or a document or something, but it basically just boils down to what's in this picture but without any shortcuts for convenience. The basic gist of the maths is:
- A histogram with bin widths of 1 is itself an approximation of the underlying discrete probability density function (in shape, obviously we're operating in units here since we didn't normalise), and we have some nice histograms for the probability distribution of numbers of players being banned or not banned in matches.
- We also have the discrete probability of players being banned or unbanned given that they are a cheater. Bayes theorem lets us use this to infer the probability of a player being a cheater given that they are unbanned given groups of players that are banned and unbanned.
- So, finally, we can apply the two probability functions to each other, and the posterior is the new expectation of the distribution of number of cheaters across games
- The earlier charts are this, given the prior that not-cheater given banned is very small, and also taking the shortcuts of just scaling the original probability mass function and rescaling the y axis (since we never bothered to actually normalise the probability), and interpolating values between the points using a line (so the discrete probability function looks like a continuous one).
6 Comments
its not really permaban though because its a free game
For someone who “dosent play the game” you spend a lot of time trying to figure out how many cheaters there are. Get a life.
Your sample sizes seem very small.
I appreciate you collecting this data, sharing it and giving this explanation. This was very confusing way to present all this info.
Still I find your way presenting this information a bit flawed and you trying to tip the statistic to point a narrative, because you refuse to acknowledge the fact in these posts that not all accounts cheat 100% of the time.
And it’s the most common thing I see when facing cheaters; I go through their seasons and usually when going back 2 to 4 seasons their stats drop like crazy. From 4-5 KD to 1 KD and win rates dropping from 20-30% to sub 5%.
It’s clear these accounts started cheating at some point, or they were bought by a cheater. Yet your statistics count these being cheaters all the time.
Like I said, I really like you collecting this data – but presenting everything as 100% facts when in fact it’s still a estimate and this being explained to you before is a bit malicious.
Some of you spend way too much time stressing about a fact of life in online gaming
It’s never going to change. You could adopt a mentality that recognizes that and doesn’t let it bother you so much, and you’d have a better time.
Cheaters don’t hold you back from getting better at the game, and if you’re letting them prevent you from having fun, you’re ignoring the vast majority of fights where you don’t run into a cheater in order to doom about the few that you do. Mentality issue.
Personally, I’m totally fine with how things are in regular matches, there are pretty much no cheaters at all. Why would they even bother exposing themselves if there’s nothing to gain?
But the fact that ranked mode is overrun with cheaters, that’s undeniable.