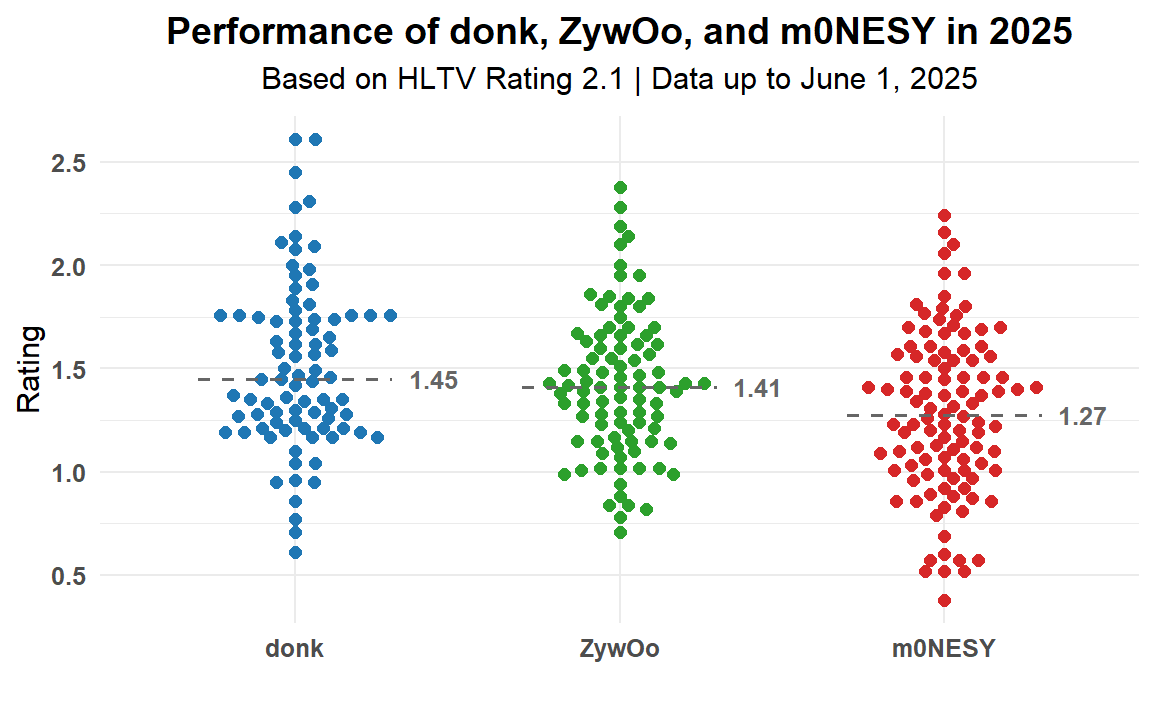
Each point represents a player’s rating on a single map. Data covers matches played from January 1 to June 1, 2025. Source: HLTV.

Each point represents a player’s rating on a single map. Data covers matches played from January 1 to June 1, 2025. Source: HLTV.
17 Comments
weird choice to use dots when the x-axis doesn’t mean anything
Remember donk didnt play all tournaments this year so far
i’m sure this post will have a lot of civil discussions
What does x axis mean?
what is this a Rorschach for gamblers?
Are those ants?
m0nesy this year isnt on level of donk and Zywoo
But that isnt hes fault
I wish someone could post the performance of VAC in `25.
now vs top 10 team? zywoo is ahead.
Sick content, keep it up 🔥💯😍🙏
The problem is that bad donk games ( < 1.00 / 1.10 ), which are rare , but when they happen against top teams almost results in a guaranteed loss for Spirit, same can’t be said for vitality and now falcons probably
Now do the comparison against a top-team while sick, a leg amputated and anesthesia administered?
I know who my goat is.
when donk does less than 1.1 his team loses lmfao
Weird spray pattern
Monesy have a lot of dot below his average rating, probably because he have to carry 3 bot in falcons
The funny thing with this stat is that there’s no context on what teams donk or m0nesy plays against with those very damn insane numbers they do per match.
Hilarious how data illiterate this community is. Cool visualization and thanks for that laugh.