

Get insights on thousands of stocks from the global community of over 7 million individual investors at Simply Wall St.
If you are wondering whether Sony Group stock at ¥3,598 is giving you a fair deal or not, a clear look at its valuation can help you decide how it might fit into your portfolio.
The share price return is flat over the past week at 0.1%, while the stock shows a 12.2% gain over 30 days, a decline of 11.8% year to date, a 1.6% return over 1 year, 45.0% over 3 years, and 80.6% over 5 years. Taken together, these figures give mixed signals about how the market has been reassessing the stock over different time frames.
Recent headlines around Sony Group have focused on its role across entertainment, gaming, and technology. This coverage often shapes how investors think about its growth opportunities and competitive position. News coverage like this typically feeds into expectations about future cash flows and risk, and that can influence how investors are prepared to value the stock.
Sony Group currently has a valuation score of 3/6. The next step is to break down what different valuation methods say about the stock today, and then look at a broader way to think about valuation that goes beyond just the numbers.
Find out why Sony Group’s 1.6% return over the last year is lagging behind its peers.
Approach 1: Sony Group Discounted Cash Flow (DCF) Analysis
A Discounted Cash Flow model takes estimates of a company’s future cash flows and discounts them back to today using a required rate of return, aiming to show what those future streams are worth in today’s money.
For Sony Group, the model used is a 2 Stage Free Cash Flow to Equity approach, based on cash flows in ¥. The latest twelve month free cash flow is about ¥1.38b. Analyst and extrapolated projections suggest annual free cash flow figures around ¥1.06b in 2026 and ¥1.05b in 2030, with intermediate years generally staying around the ¥1.0b level according to the provided projections.
Rolling all of these projected cash flows together and discounting them back produces an estimated intrinsic value of ¥2,877 per share. With the current share price at ¥3,598, the DCF output implies the stock is about 25.0% more expensive than this intrinsic value estimate, which indicates Sony Group is trading at a premium on this model.
Result: OVERVALUED
Our Discounted Cash Flow (DCF) analysis suggests Sony Group may be overvalued by 25.0%. Discover 16 high quality undervalued stocks or create your own screener to find better value opportunities.
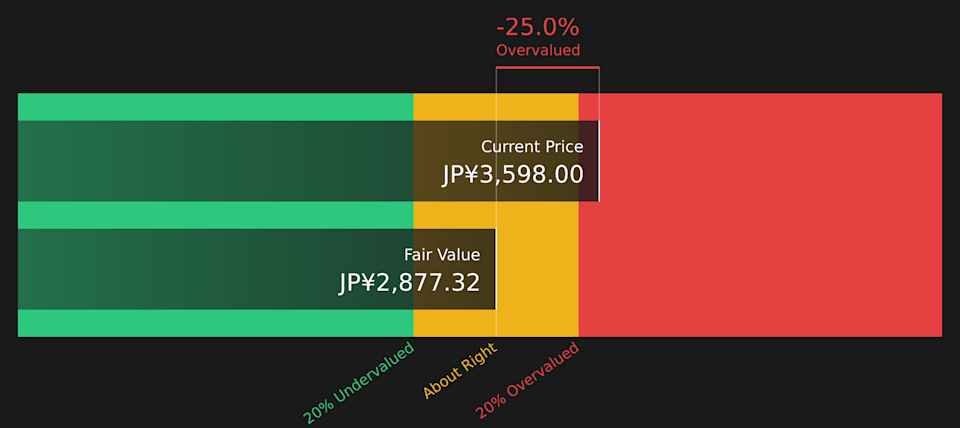 6758 Discounted Cash Flow as at May 2026
Head to the Valuation section of our Company Report for more details on how we arrive at this Fair Value for Sony Group.
Approach 2: Sony Group Price vs Earnings
For profitable companies, the P/E ratio is a useful yardstick because it ties what you pay for the stock directly to the earnings it generates. In general, higher growth expectations or lower perceived risk can justify a higher P/E, while slower growth or higher risk tend to be associated with a lower P/E that investors are willing to pay.
Sony Group currently trades on a P/E of 20.6x. That sits well above the wider Consumer Durables industry average of 9.6x, and very close to the peer group average of 20.8x. This suggests the stock is broadly in line with similar companies rather than the sector as a whole.
Simply Wall St’s Fair Ratio for Sony Group is 23.5x. This is a proprietary estimate of what a reasonable P/E could be after accounting for factors such as earnings growth, profit margins, industry, market capitalization and company specific risks. Because it blends these elements together, the Fair Ratio can be a more tailored guide than a simple comparison with peers or the industry average, which may not share Sony Group’s specific strengths or risk profile. With the current P/E of 20.6x sitting below the Fair Ratio of 23.5x, the stock screens as undervalued on this metric.
Result: UNDERVALUED
 TSE:6758 P/E Ratio as at May 2026
P/E ratios tell one story, but what if the real opportunity lies elsewhere? Start investing in legacies, not executives. Discover our 13 top founder-led companies.
Upgrade Your Decision Making: Choose your Sony Group Narrative
Earlier it was mentioned that there is an even better way to understand valuation. Narratives let you attach a clear story about Sony Group to the numbers you care about, linking your view on future revenue, earnings and margins to a fair value estimate that you can easily compare with the current share price.
On Simply Wall St’s Community page, Narratives are available as an accessible tool used by millions of investors. They update automatically as new earnings or news arrive so your fair value view is always tied to the latest information rather than a static spreadsheet.
For Sony Group, one investor might lean toward the more cautious view that aligns with a fair value around ¥3,574.99, while another might back a more optimistic view closer to ¥5,900. Narratives make it straightforward for you to see which story you agree with and how that translates into a fair value relative to the current price.
For Sony Group, here are previews of two leading Sony Group Narratives to make comparison easier:
🐂 Sony Group Bull Case
Fair value: ¥4,764.78
Current price vs this fair value: about 24.5% below this narrative fair value
Revenue growth assumption: 20.2%
Analysts see the gaming and music content portfolio, including PlayStation network services and proprietary IP, as important for recurring digital revenue and margin support.
Sensor technology and content focused devices are expected to support earnings resilience while Sony continues to adjust its supply chain and cost base.
The fair value of ¥4,764.78 sits between a bullish ¥5,900 and a more cautious ¥3,400, so your view on tariffs, AI impacts on music catalogs and console economics matters for how you treat that target.
🐻 Sony Group Bear Case
Fair value: ¥3,574.99
Current price vs this fair value: about 0.7% below this narrative fair value
Revenue growth assumption: declines 15.5%
This narrative focuses on later stage PS5 hardware, reliance on a handful of live service hits and rising memory costs as reasons to be cautious about how much earnings can grow from here.
It also highlights pressure points in music streaming margins and image sensor demand if smartphone makers trim camera specs or push harder on component pricing.
With a fair value of ¥3,574.99, this view implies only a small gap to the current price, so it treats Sony Group as closer to fully valued once these risks are factored in.
Whichever story you lean toward, the key is that both narratives spell out the earnings, margins and valuation assumptions in detail. That allows you to decide which set of numbers feels closest to your own expectations for Sony Group over the next few years, then judge how that compares with today’s ¥3,598 share price.
To see how these results tie into long-term growth, risks, and valuation, check out the full range of community narratives for Sony Group on Simply Wall St. Add the company to your watchlist or portfolio so you’ll be alerted when the story evolves.
Do you think there’s more to the story for Sony Group? Head over to our Community to see what others are saying!
TSE:6758 1-Year Stock Price Chart
This article by Simply Wall St is general in nature. We provide commentary based on historical data and analyst forecasts only using an unbiased methodology and our articles are not intended to be financial advice. It does not constitute a recommendation to buy or sell any stock, and does not take account of your objectives, or your financial situation. We aim to bring you long-term focused analysis driven by fundamental data. Note that our analysis may not factor in the latest price-sensitive company announcements or qualitative material. Simply Wall St has no position in any stocks mentioned.
Companies discussed in this article include 6758.T.
Have feedback on this article? Concerned about the content? Get in touch with us directly. Alternatively, email editorial-team@simplywallst.com