
Over the past months we have been running a research project focused on AI-assisted remote diagnostics for high-performance computer systems. As part of this work, we published a white paper and a complete multimodal dataset built around a real GPU case study, including 457 telemetry channels sampled every 2 seconds, IR thermography, UV optical inspection, and benchmark data before and after repaste.
The platform was an RTX 3080 Gigabyte Eagle evaluated across four stages:
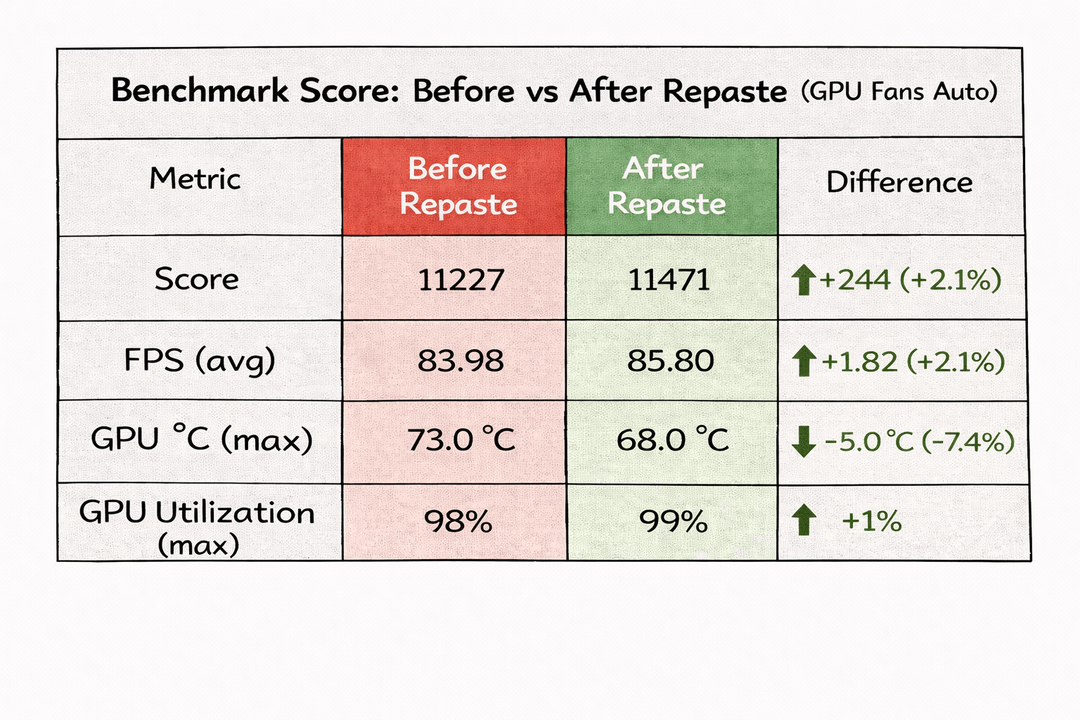
Stage A: old TIM, automatic fan profile
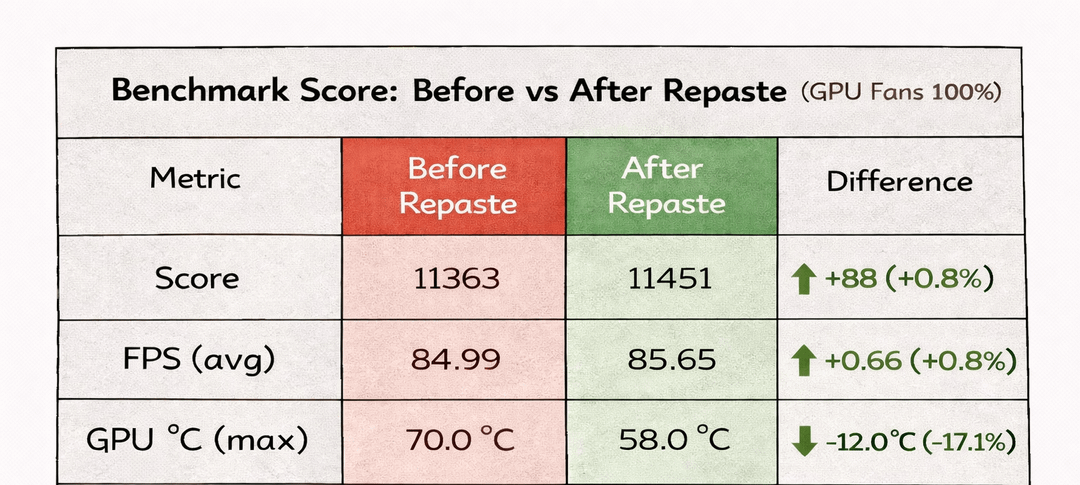
Stage B: old TIM, 100% fan profile
Stage C: new TIM, automatic fan profile
Stage D: new TIM, 100% fan profile
For full transparency, we are the authors of this study and the manufacturer of the materials used. The dataset and telemetry logs are published openly so that anyone can independently review the findings.
The intervention consisted of KRYO33 on the GPU die and K5 PRO Mt. Olympos Edition on VRAM and VRM contact regions.
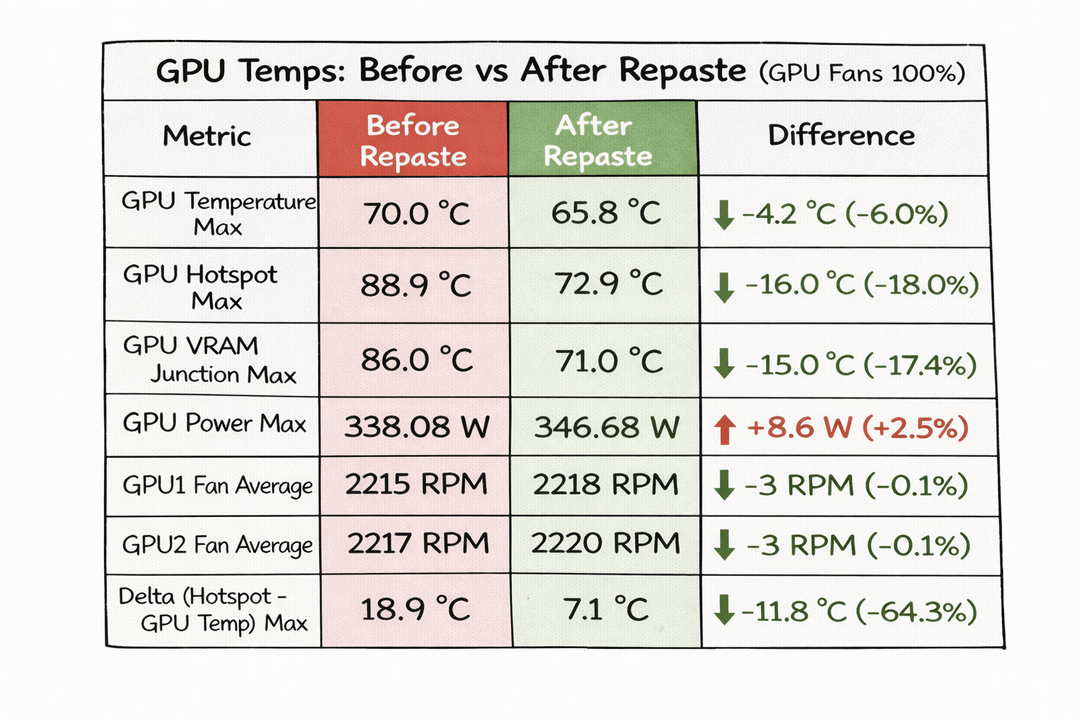
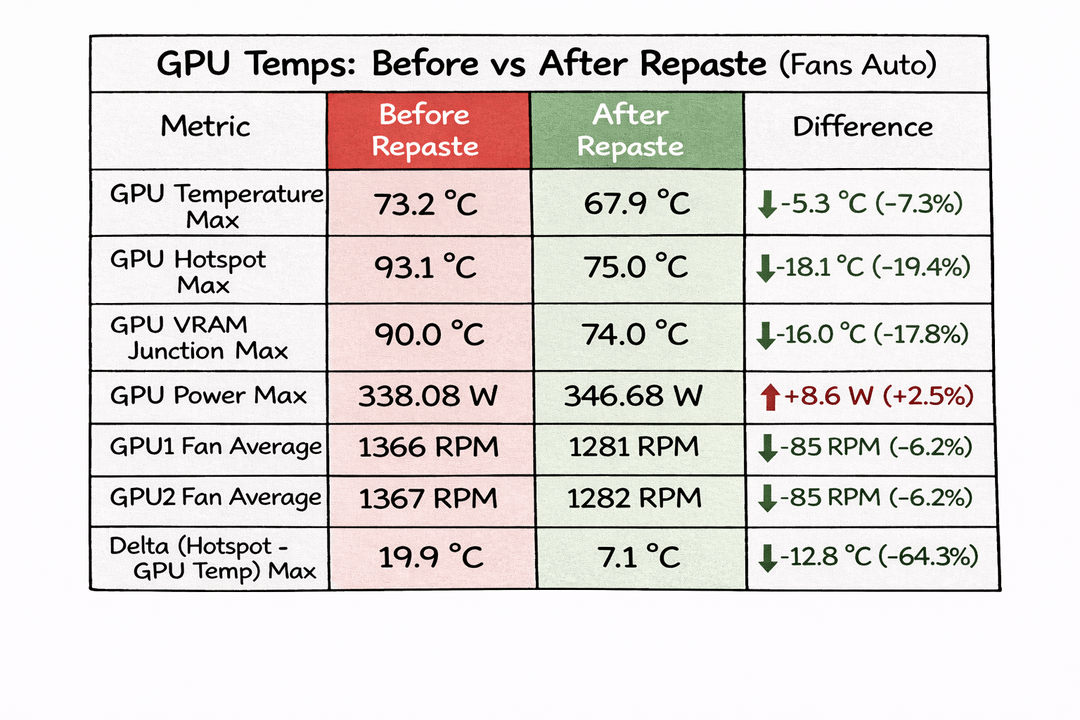
The results were not marginal. Under the automatic fan profile, GPU hotspot max dropped from 93.1°C to 75.0°C, a reduction of −18.1°C. VRAM junction max dropped by −16.0°C. The peak hotspot-to-core delta was reduced by 64.3%, from 19.9°C down to 7.1°C. With fans locked at 100%, hotspot dropped by −16.0°C and VRAM by −15.0°C.
At the same time, GPU power draw increased by +8.6 W, or +2.5%, and utilization stabilized at 99%. In other words, the card was previously hitting thermal limits. After optimizing the interface, it consumed more power while operating significantly cooler. That is real thermal headroom, not just a cosmetic temperature improvement.
Under the automatic fan profile, average fan speed decreased by roughly 85 RPM while peak temperatures were lower. This translates into reduced acoustic footprint and potentially less long-term mechanical stress on the fans.
For an overclocking audience, the most critical takeaway is not only the absolute temperature drop but the dramatic reduction in hotspot-to-core delta. A large delta is often a sign of uneven contact or localized interface resistance. Bringing that delta down to ~7°C indicates much more uniform thermal coupling between silicon and heatsink.
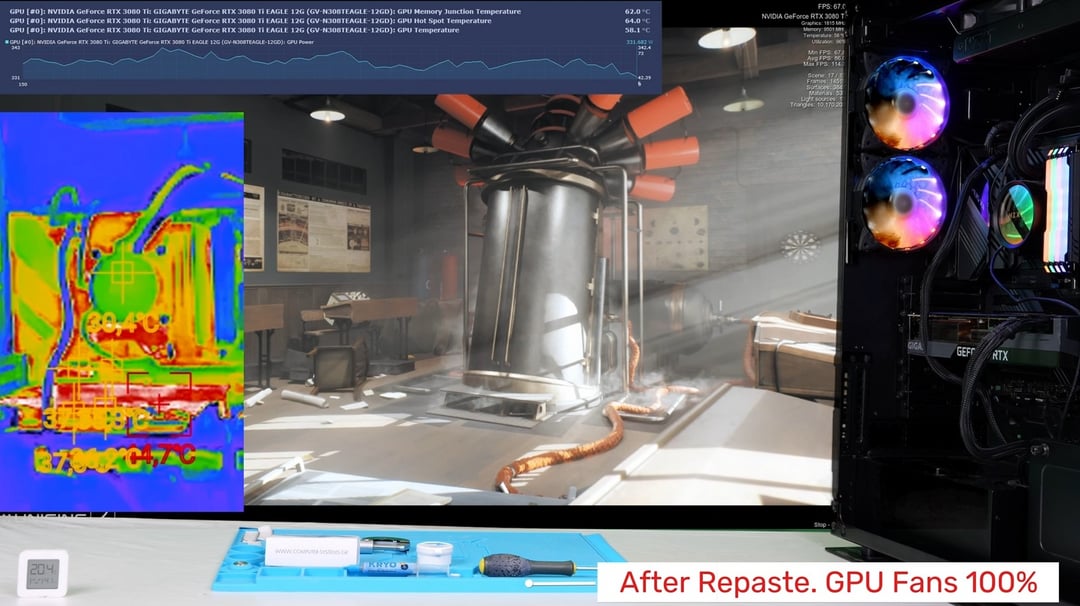
Infrared thermography was used as a complementary validation layer rather than as a primary temperature measurement tool. The IR camera was positioned to monitor the heatsink fin stack, the PCB region around the GPU, and adjacent motherboard zones during the benchmark load. Because IR in service conditions reflects apparent temperature rather than laboratory-calibrated absolute values, its role was comparative and spatial. In the “before” runs, heat appeared more concentrated around PCB-adjacent regions while the heatsink fins were less uniformly activated. After the interface optimization, although on-die sensor temperatures were substantially lower, the heatsink fin array appeared hotter and more uniformly engaged. This indicates that thermal energy was reaching the dissipation surface more effectively and being transferred to the airflow path, consistent with reduced interface thermal resistance. In other words, the IR footage visually confirmed that heat flow had shifted from localized board hotspots toward the intended cooling structure.
The UV inspection stage was particularly revealing. Even when the application by an experienced technician appeared generous, UV fluorescence exposed dark regions where the material had not fully spread due to its rheology and local geometry. The workflow was deliberate: mount with full pressure, disassemble, inspect under UV, add material only where voids were detected, and repeat until continuous coverage was verified. Only then was the final assembly performed.
This connects to an ongoing discussion in the community about “using too much” thermal putty. Many viscous compounds sold as thermal putties are not optimized for this specific mechanical role. If a material lacks sufficient elasticity, excess volume can indeed interfere with proper clamping. On the other hand, if a compound is engineered to remain compliant under pressure and across thermal cycles, it can fill micro-voids without preventing minimum bond-line thickness. In this case study, K5 PRO Mt. Olympos Edition was selected specifically for its elastic behavior in memory and VRM regions, and the effect was validated both optically and thermally.
The broader goal of the project is to train computer vision models on UV and visible images so that, before final reassembly, a single image can be used to assess the likelihood of incomplete contact and future hotspot formation. Telemetry tells you that a thermal problem exists. Optical evidence can help determine whether the root cause is interface-related, even in remote workflows.
For anyone interested in reviewing the full data, everything is publicly available:
White Paper: https://zenodo.org/records/18771556
Dataset: https://zenodo.org/records/18760718
Video 4K: https://www.youtube.com/watch?v=ojLrEOglty8
Feedback from those who routinely work with high-power GPUs, especially in VRAM-intensive scenarios, would be highly valuable. In many cases, junction temperature and hotspot delta reveal more about interface quality than core temperature alone.