
Long story short, these are the rough rankings for orgs that participated in any PCS or globals since June 2020.
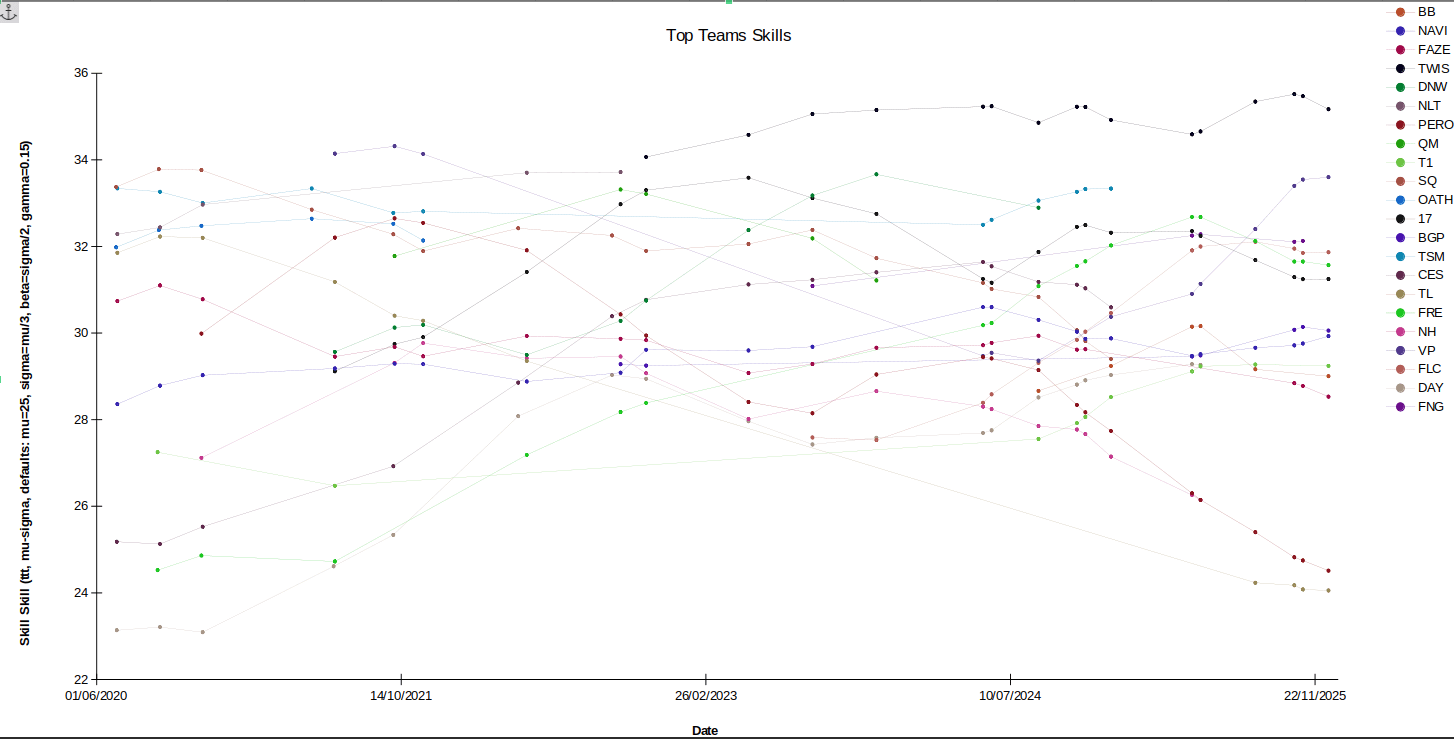
You can find a link to them here (Reddit filtered my post when I tried to link them directly). The full results are in all.csv. The input data is in globals.csv. Pic is a selection of teams I found interesting for some reason or who were/are highly ranked at some point etc.
Subsets of the results for each region are provided in .xlsx format with a chart, because being able to mouse over the lines to see which team is which is kind of necessary when there are more than a handful of team. They should work in Excel, but I haven't checked, and they definitely don't work in Google Sheets. There is an example picture included called example.png – if you open the spreadsheet in Excel and the chart doesn't look like that then I guess you got screwed and you'll either have to get Calc or learn how to make charts from data in Excel.
See first reply for extra info, disclaimers etc.