
. Added a second tab, now it measures more data")
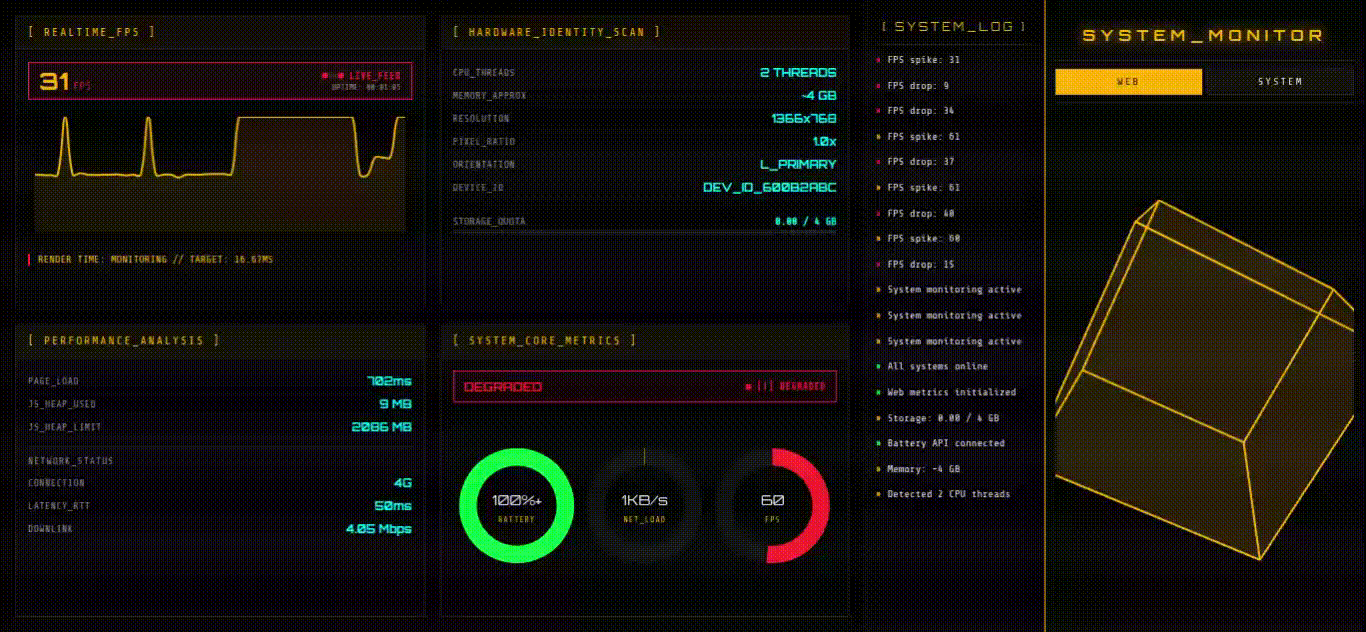
All data is 100% real and updates live.
It has:
- Real-time FPS counter (works)
- Live feed indicator with blinking LEDs (works)
- Session uptime counter (HH:MM:SS) (works)
- Oscilloscope-style frame time chart (works)
- Render time monitoring (target: 16.67ms) (works)
- CPU thread count detection (works)
- Approximate RAM amount (~GB) (works)
- Screen resolution display (works)
- Pixel ratio (DPI scaling) (works)
- Screen orientation (portrait/landscape) (works)
- Generated device ID (hash-based) (works)
- Storage quota usage bar with GB metrics (works)
- Page load time (milliseconds) (works)
- JavaScript heap memory used (works)
- JavaScript heap memory limit (works)
- Network connection type (4G/5G/WiFi) (works)
- Network latency (RTT in ms) (works)
- Download bandwidth (Mbps) (works)
- Overall browser health status badge (optimal/degraded) (works)
- LED health indicator (works)
- Battery level pie chart with charging indicator (works)
- Network load pie chart (KB/s activity) (works)
- FPS performance pie chart (works)
- Real-time CPU percentage (works)
- Live feed indicator with blinking LEDs (works)
- System uptime counter (works)
- Historical CPU usage line chart (works)
- CPU core count (works)
- System load average (works)
- System hostname (works)
- Operating system name and release version (works)
- CPU core count (works)
- Processor model name (works)
- System architecture (x86_64, ARM, etc.) (works)
- RAM usage bar (used/total GB) (works)
- Disk usage bar (used/total GB) (works)
- Historical memory usage line chart (works)
- Available memory (MB) (works)
- Total memory (MB) (works)
- Memory used (MB) (works)
- Memory usage percentage (works)
- Scrollable parameter list with 22 metrics: (works)
- CPU total percentage (works)
- CPU per-core percentage (works)
- Load averages (1min, 5min, 15min) (works)
- Memory percent, MB, GB, available (works)
- Disk percent, used GB, free space (works)
- Network RX/TX rates (KB/s) (works)
- Network RX/TX totals (works)
- Network total GB transferred (works)
- Active process count (works)
- System uptime (seconds and formatted) (works)
- Hostname (works)
- Historical network activity line chart (works)
- Receive rate (RX KB/s) (works)
- Transmit rate (TX KB/s) (works)
- Total bytes received (works)
- Total bytes transmitted (works)
- Overall system health status badge (optimal/degraded) (works)
- LED health indicator (works)
- CPU usage pie chart with percentage (works)
- RAM usage pie chart with percentage (works)
- Disk usage pie chart with percentage (works)
- Current timestamp (works)
- Scrollable event log (works)
- Color-coded messages (info/warn/success) (works)
- System events and notifications (works)
- Auto-scrolling with 50-message limit (works)
- Timestamps for alerts (works)
… Cyberpunk rules, dude.