


Hey everyone,
I’m working on a personal project called Project ARIS. It’s a full desktop application I’m building to visualize and analyze spectroscopy data from telescopes like JWST and TESS.
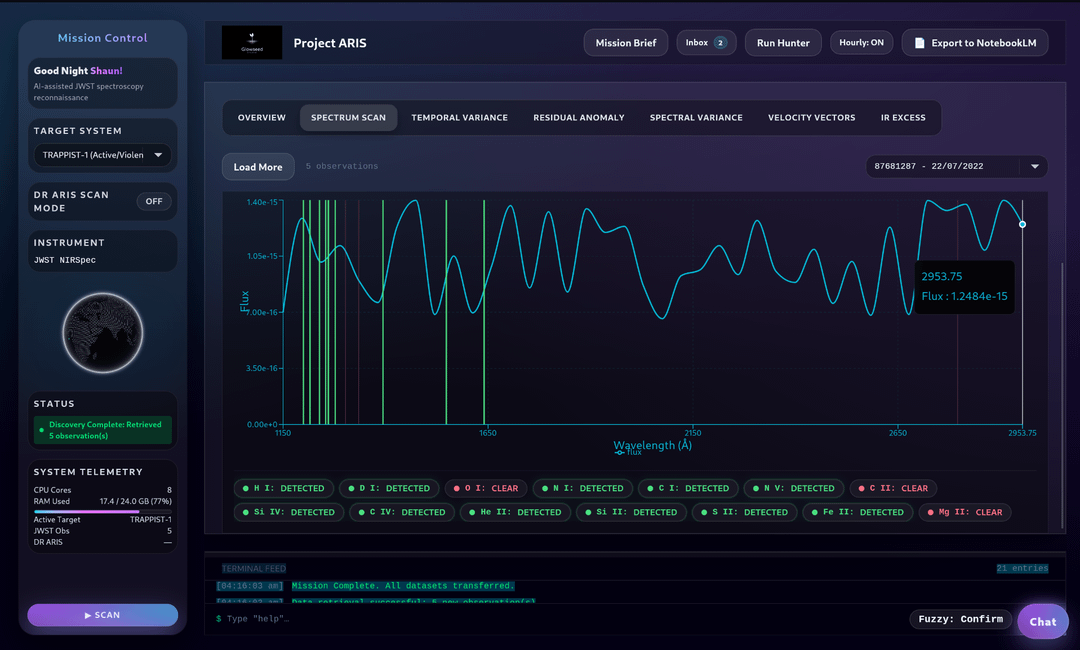
I wanted to move away from the white "spreadsheet" look of standard scientific tools and build a proper Mission Control interface. Since I do most of my coding and observing at night, I leaned into a dark, glass-heavy UI to reduce eye strain while keeping the data density high.
It wasn't explicitly designed to be "cyberpunk," but the combination of the dark glassmorphism, real-time spectral charts, and the system telemetry sidebar definitely gives it that "off-world console" feel.
The Setup:
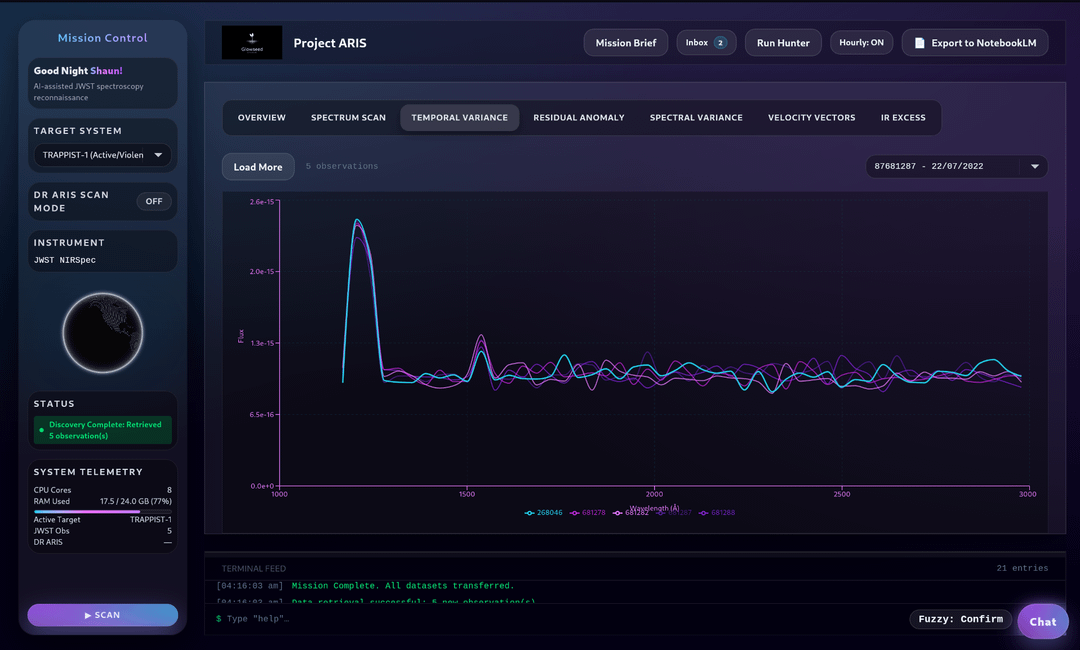
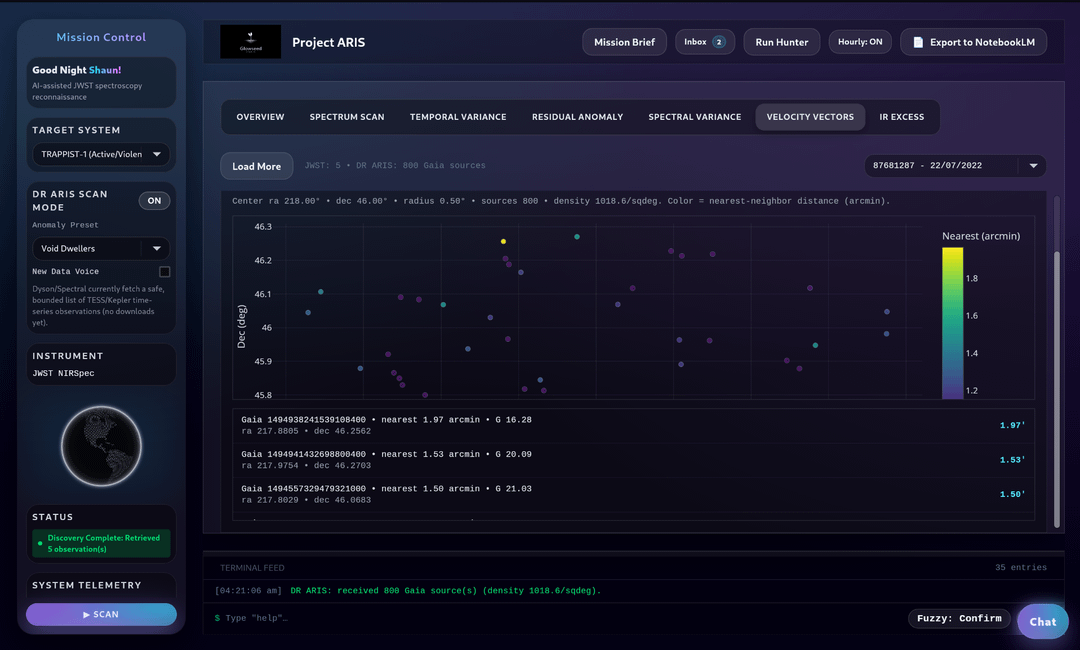
The App: It’s a full GUI dashboard, not just a CLI. It renders interactive charts for light curves, spectral variance, and anomaly detection.
The "Brain": It runs a local LLM (via Ollama) to help flag data anomalies offline.
The Stack: Built with Tauri and Rust on Nobara Linux.
It’s still a work in progress, but I thought this sub might appreciate the aesthetic direction.