
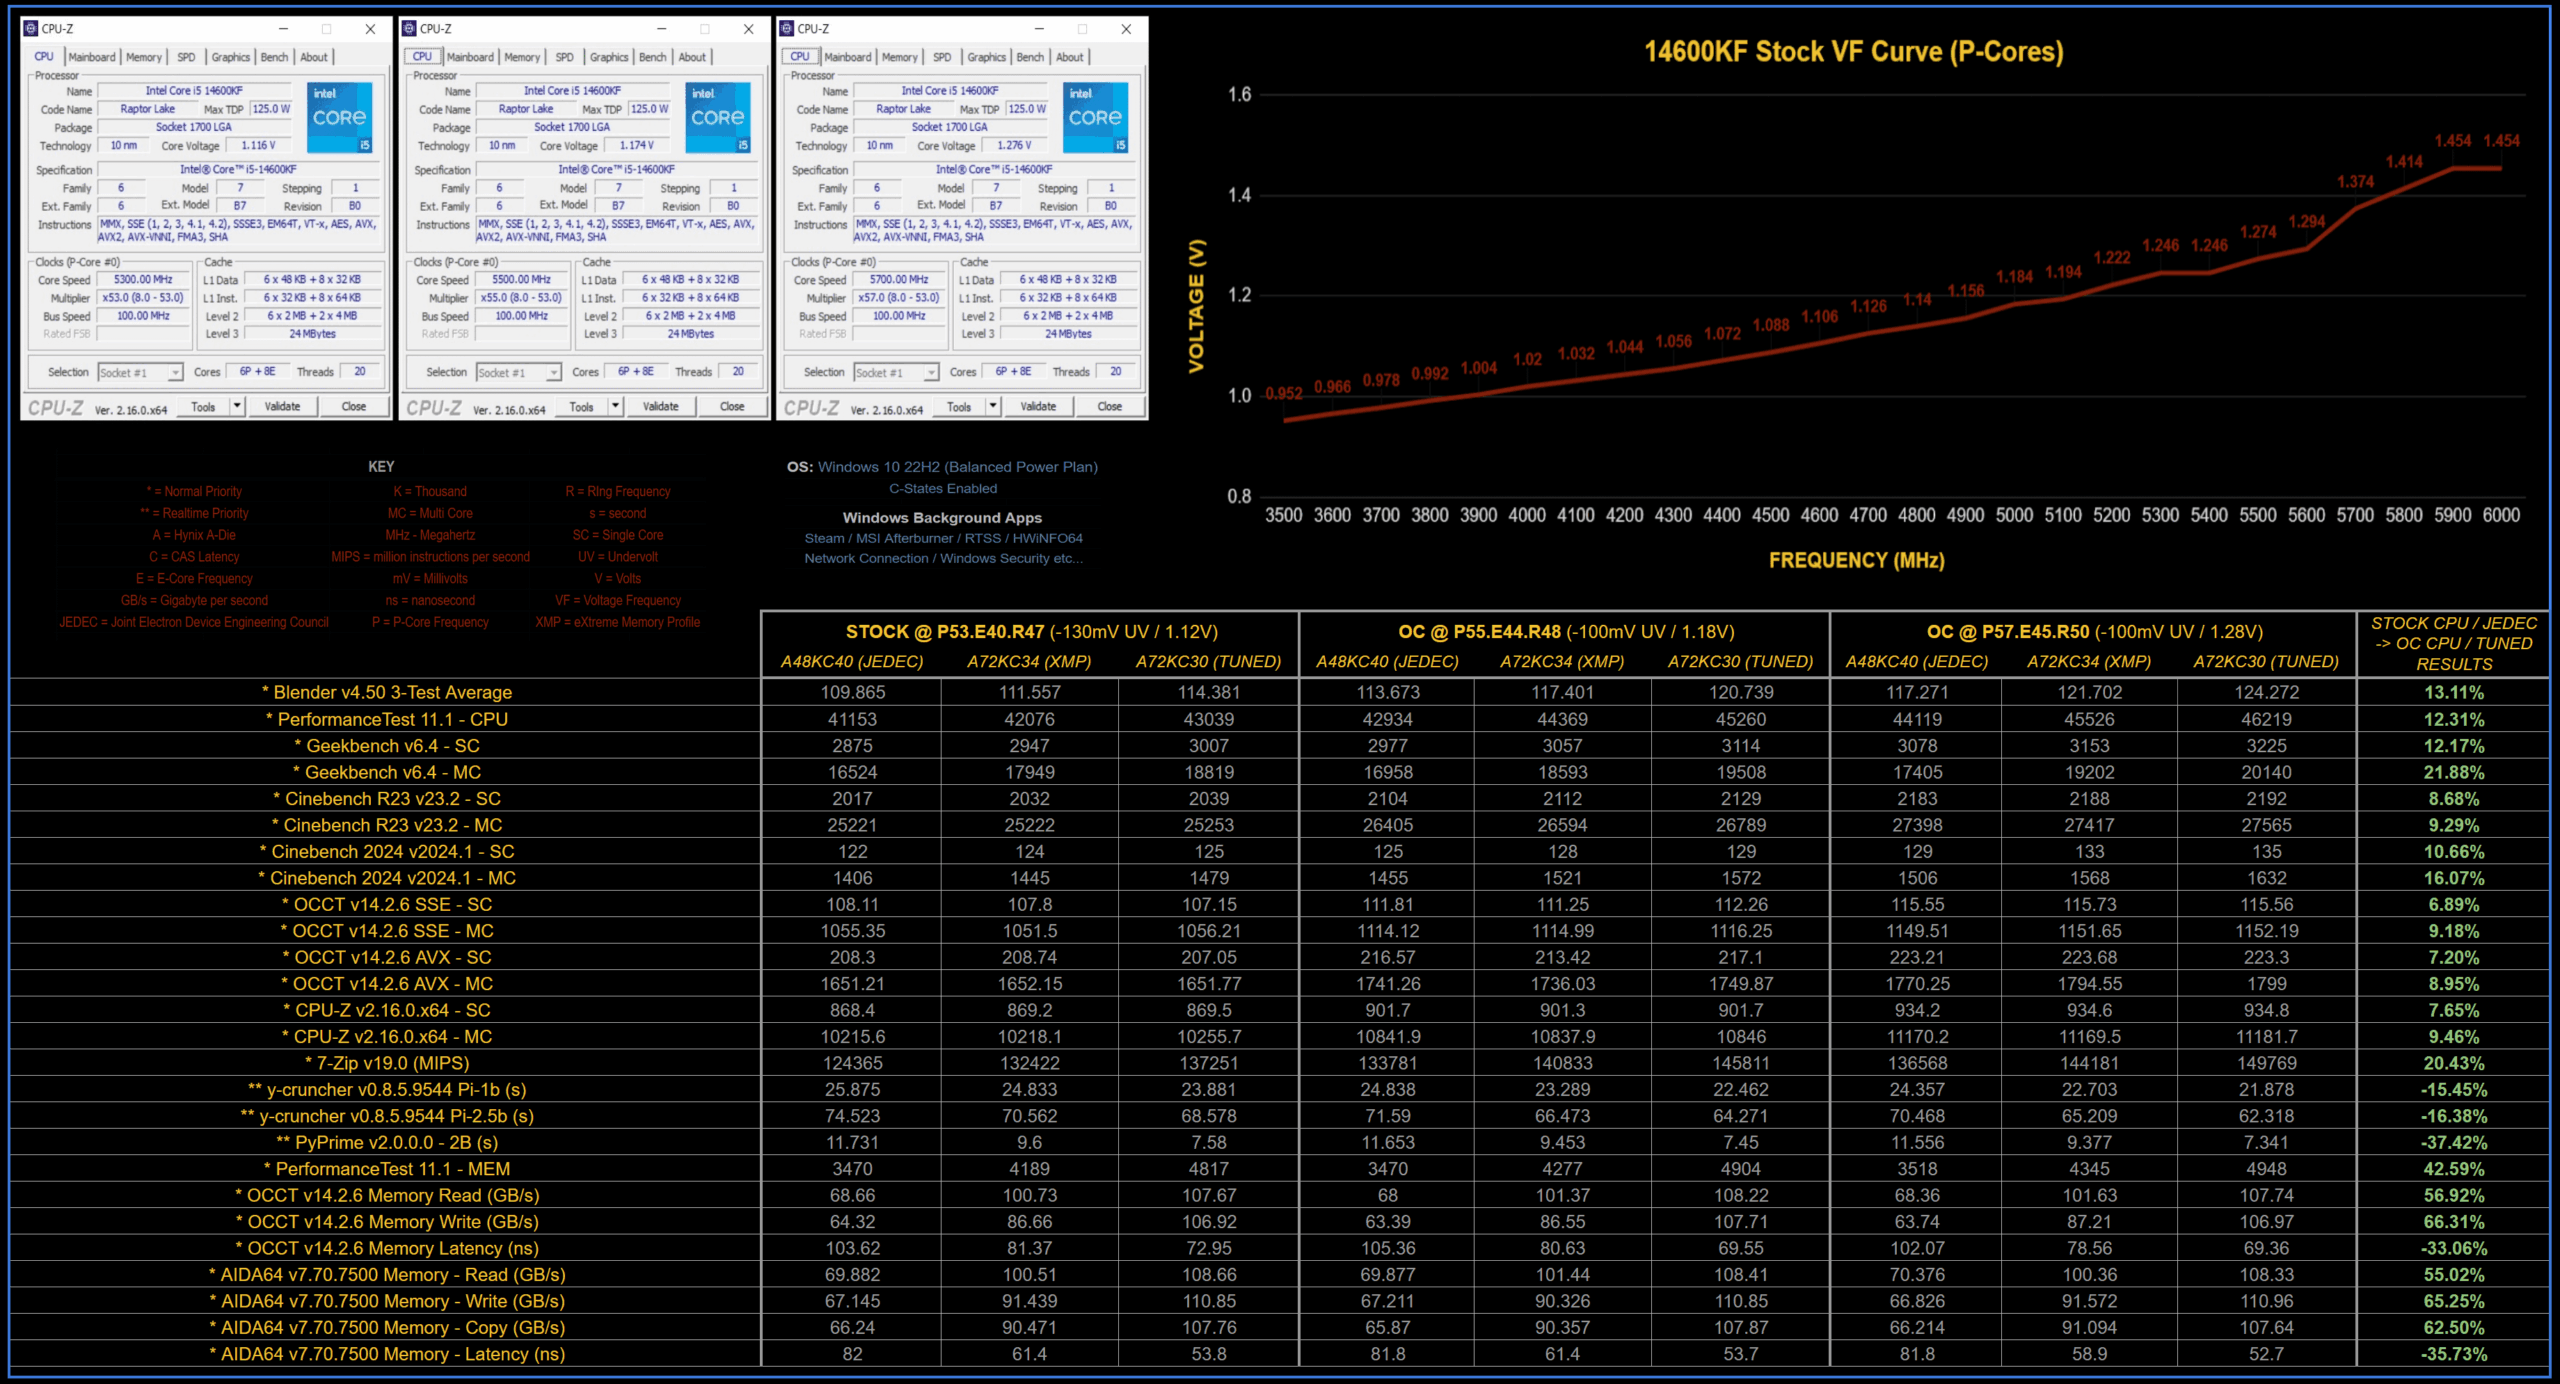
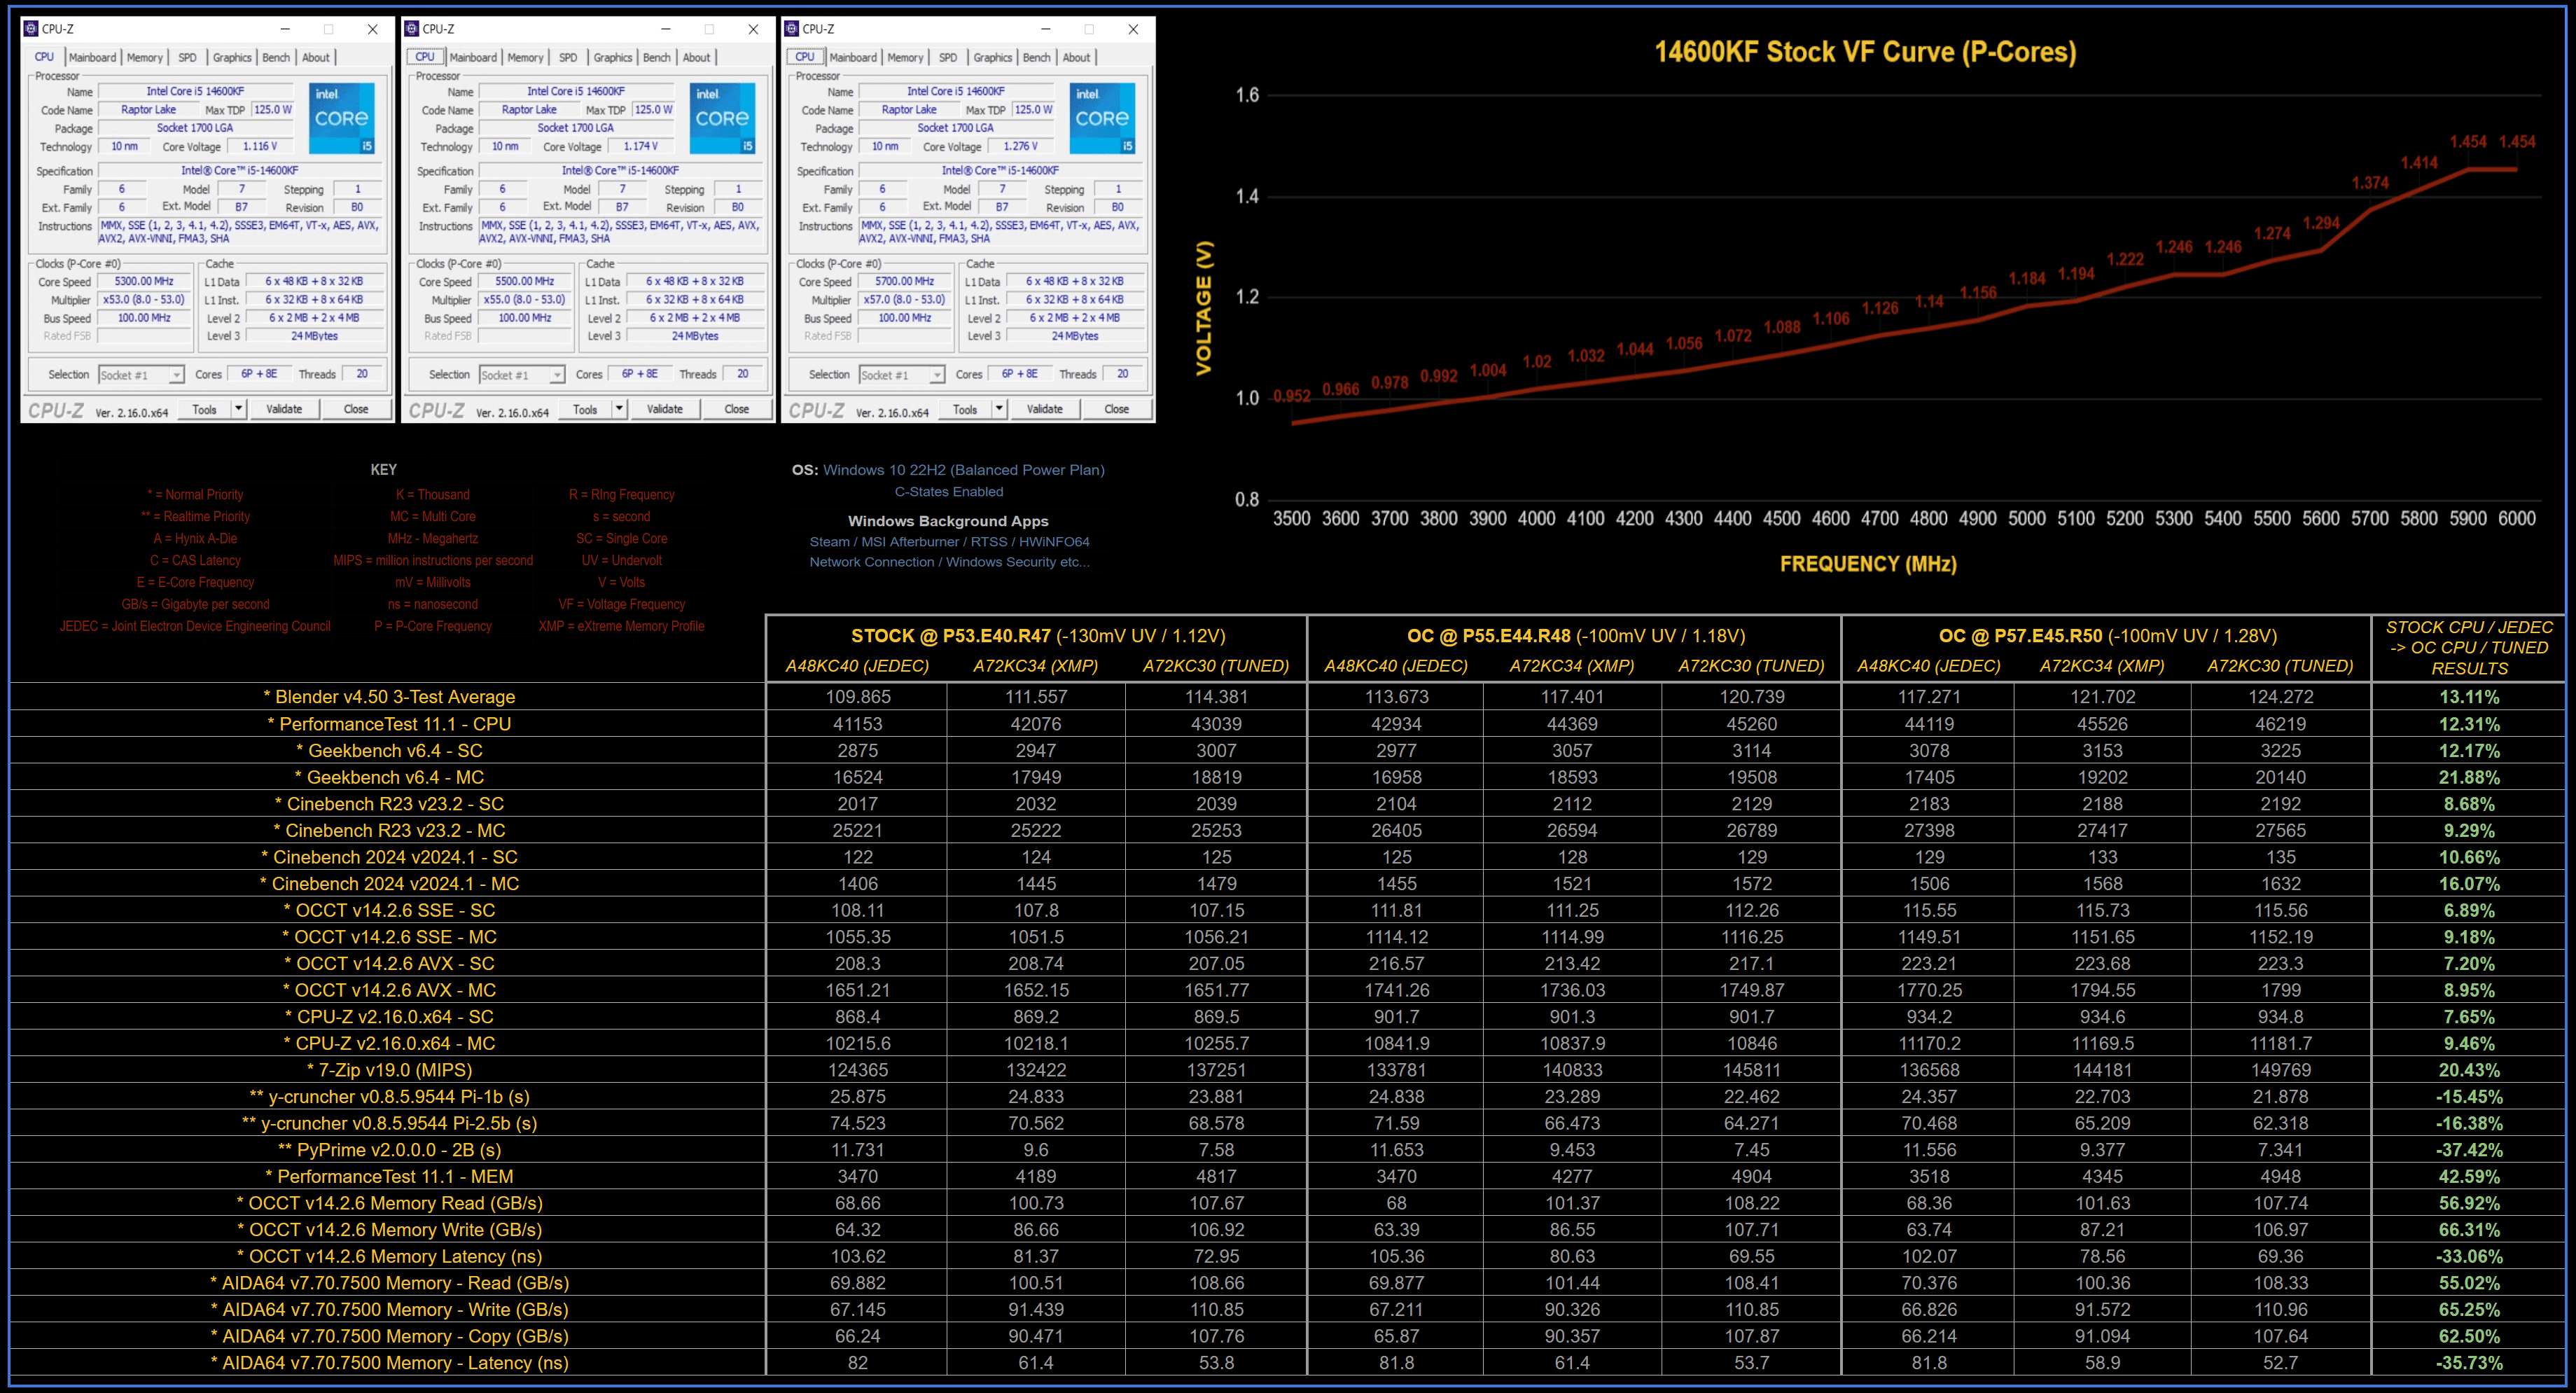
I've been happily using the 150USD 14600KF tray processor with an MSI Z790 motherboard for about six months without issues. I decided to fine-tune a few of my undervolted user created profiles, this required revealing the default voltage frequency curve for my 14600KF.
With the most recent stable BIOS release previously applied, I set the voltage limit to 1.5v, hyperthreading on, disabled e-cores, locked ring frequency to 800MHz and began the documentation. Originally I only intended to note 3500MHz to 6000MHz on a basic spreadsheet, but after completion I reconsidered and plotted the VF curve in its entirety.
I fine-tuned the stock / overclocked undervolted profiles, stress-tested and benchmarked using tuned memory settings. I made JEDEC & XMP profiles to verify how much impact differing processor frequencies / memory speeds and timings have on performance. Over the following week or two I continued to benchmark and proceeded to collate results.
The chart created was for private use / historical data only, but I thought some redditors (especially those with 14 core/20 thread, 13th/14th generation processors) may find it interesting, useful or both, so I tweaked it a little for public consumption.